Thanks Patrick. I was slightly surprised to see HDF files being used. I suspect that might be non-standard (in the sense that other NEON sites won’t use them) but I could be wrong.
We should make sure that you get credit - authorship, where appropriate - for doing all of this. It is much appreciated.
Hi Tristan:
I am pretty sure the use of HDF files is standardized across all the NEON sites, at least for the Bundled eddy covariance data. The precipitation and relative humidity data are in separate files, and those are CSV.
Thanks for the offer of possible co-authorship! That sounds great!
Patrick
Hi Tristan:
At least the primary shortwave downward flux at tower top for SCBI is available separately as a CSV file. The bundled eddy covariance data is in HDF5 format. I can redo the coding and the downloading, if you’d prefer to use only the CSV files instead of the HDF5 files.
Patrick
Hi. No, it’s fine. Happy for you to proceed as you see fit. I just thought I’d flag it.
Hi Tristan:
I just finished a working first draft of code that can read the BundledEddyCovariance-HDF5 file, the relative-humidity CSV file, and the precipitation CSV file for each month for the Smithsonian SCBI site in Virginia. This code then merges the files together (in HDF5 format, for now).
The next step is to make it in the proper merged JULES CSV format, and to check the units, and to do some tests, etc.
Patrick
Hi Tristan:
I now have checked in some code here:
https://code.metoffice.gov.uk/trac/roses-u/log/a/l/7/5/2/u-al752-processing/bin/readTower.py?rev=239102
This code reads 3 different sets of 30-minute HDF5 or CSV files for each month (Bundled Eddy Covariance, Precipitation, and Relative Humidity) for the NEON Smithsonian SCBI site in Virginia, for several years, and outputs a CSV file with data columns with these headings:
`[‘time’, ‘t’, ‘sw_down’, ‘q’, ‘lw_down’, ‘pstar’, ‘precip’, ‘wind’].
I also added an option to switch from the primary precipitation sensor to the secondary precipitation sensor, since there is often missing data for the primary sensor.
Patrick
Hi Tristan:
With the SCBI NEON site, I have followed most of Karina’s instructions from 6.7.2020 (reposted here, above, on 29.9.2022), and JULES now runs in the u-al752 suite for a few days of spinup, before failing with numerical errors in qsat. I had to add 4 years of global CO2 data (2018-2021) to the PRESCRIBED CO2 file.
The JULES failure is expected (and often happens in other runs), since I have yet to put the proper soil values into the suite. I hope to get these proper soil values within a week or two. There also might be other adjustments that need to be made to the settings. But the whole process as outlined by Karina seems to work, overall.
I have hacked Karina’s u-al752 suite and her u-al752-processing suite so that it skips all the FLUXNET sites and all the LBA sites, and so that it just runs on the NEON sites.
I am now using R and the NEON API to download the necessary CSV and HDF5 files for 5 other NEON sites (“ABBY”,“BARR”,“BART”,“BLAN”, and “CPER”) directly to JASMIN from the NEON site. And I will then run the processing scripts and follow Karina’s protocol to get the suite running for all 6 sites.
Patrick
Hi Patrick,
That’s great to hear!
I have hacked Karina’s u-al752 suite and her u-al752-processing suite so that it skips all the FLUXNET sites and all the LBA sites, and so that it just runs on the NEON sites.
A way to do this which is consistent with the implementation for the other datasets would be
set SUBSET=‘neon’ and then change
https://code.metoffice.gov.uk/trac/roses-u/browser/a/l/7/5/2/trunk/suite.rc#L87
(if the neon sites don’t have a consistent naming scheme, you could list them in this file
https://code.metoffice.gov.uk/trac/roses-u/browser/a/l/7/5/2/trunk/var/info.inc#L87
as is done for wetland sites)
Cheers
Karina
Thanks, Karina:
Yes, I did use the SUBSET=‘neon’ to hack the u-al752 suite. But there were more changes needed to do this for the u-al752-processing suite.
Patrick
Hi Tristan:
I figured out a decent way to download the data from the NEON server to JASMIN:
ssh -AX sci1
#cd to where you want to store the NEON data
screen #to avoid loss of interactive connection
module load jasr
R
#These are the R commands to use:
library(neonUtilities)
getOption('timeout') #this should return 60 (seconds)
options(timeout=1200)
PACKAGE <- "basic"

sites <- c("SCBI","CPER","ABBY","BARR","BART","BLAN") #list of NEON sites to download for
MyToken <- TOKEN FROM REGISTERING ON NEON WEBSITE #for higher download speeds
#bundled eddy covariance, precipitation, relative humidity
dpList <- c("DP4.00200.001","DP1.00098.001","DP1.00006.001")
for (dp in dpList) {
tp <- zipsByProduct(dpID=dp, timeIndex=30, site=sites, package=PACKAGE, check.size=T,token=MyToken)
}
Hi Tristan:
So I have the NEON meteorological data downloaded for 6 sites, and I did the processing for 3 of them (“SCBI”=Virginia,“CPER”=Colorado,“ABBY”=WashingtonState) for 7 months of the data (Dec 2020 - Jun 2021) in order to get the data in the JULES format. One new thing that I have done is to fill the temporal missing-data gaps by forward-fill. I am hoping my local JASMIN copy of JULES suite u-al752 will run for longer than 7 days of spinup now.
I have also followed most of the steps in Karina’s protocol in getting the suite ready to run for these 3 sites. One main exception is that I have not explicitly downloaded or processed data for the carbon and energy observational fluxes from NEON. This is processing that is in the u-al752 suite, and which I have temporarily disabled.
Also, I need to work on a way to automate the determination of the sensor positions, since these determine the strings used to extract the data. Right now, I am doing this manually. And the same goes for automating the determination of the site info (time zone, lat/lon, vegetation classification, soil data). I am sure there is a file or something somewhere for this data, but right now, I am just reading the website for each site, and manually entering those. The soil data are dummy values for now, as well.
In addition to working on the 3 other sites in my current subset (“BARR”=Alaska,“BART”=NewHampshire,“BLAN”=Virginia), I can start working on some of the things in the last 2 paragraphs.
Patrick
Hi Tristan:
The JULES runs I did yesterday ran for longer than the previous limit of a few calendar days. Two of the three NEON sites ran for 1 spin-up period and failed in the 2nd spin-up period. The 3rd NEON site failed during the 1st spin-up period. Right now, I am using a super-short spin-up period of 7 months. Soon, I plan to extend this spin-up period to several years.
Also, just now, I have replaced the dummy values for the three NEON sites for the soil textures (SAND, SILT, CLAY) with more proper values from the CAP ancillary. (CAP=Central Ancillary Project). I am currently rerunning the current version of the 3-site NEON-subset version of the u-al752 suite, in order to see if JULES can run for longer or not.
Patrick
Hi Tristan:
I have been able to use the new trunk version of the JULES FLUXNET/NEON suite u-al752 in order to run JULES for 8 spinup cycles and the main run for 5 NEON sites (“SCBI”,“CPER”,“ABBY”,“BART”, and “BLAN”). The driving-data time range for these 5 NEON sites covered practically the whole range of data available for each site starting usually in 2016 or 2017. I ran until the end of 2021, which is the end of the global prescribed CO2 data that I amended.
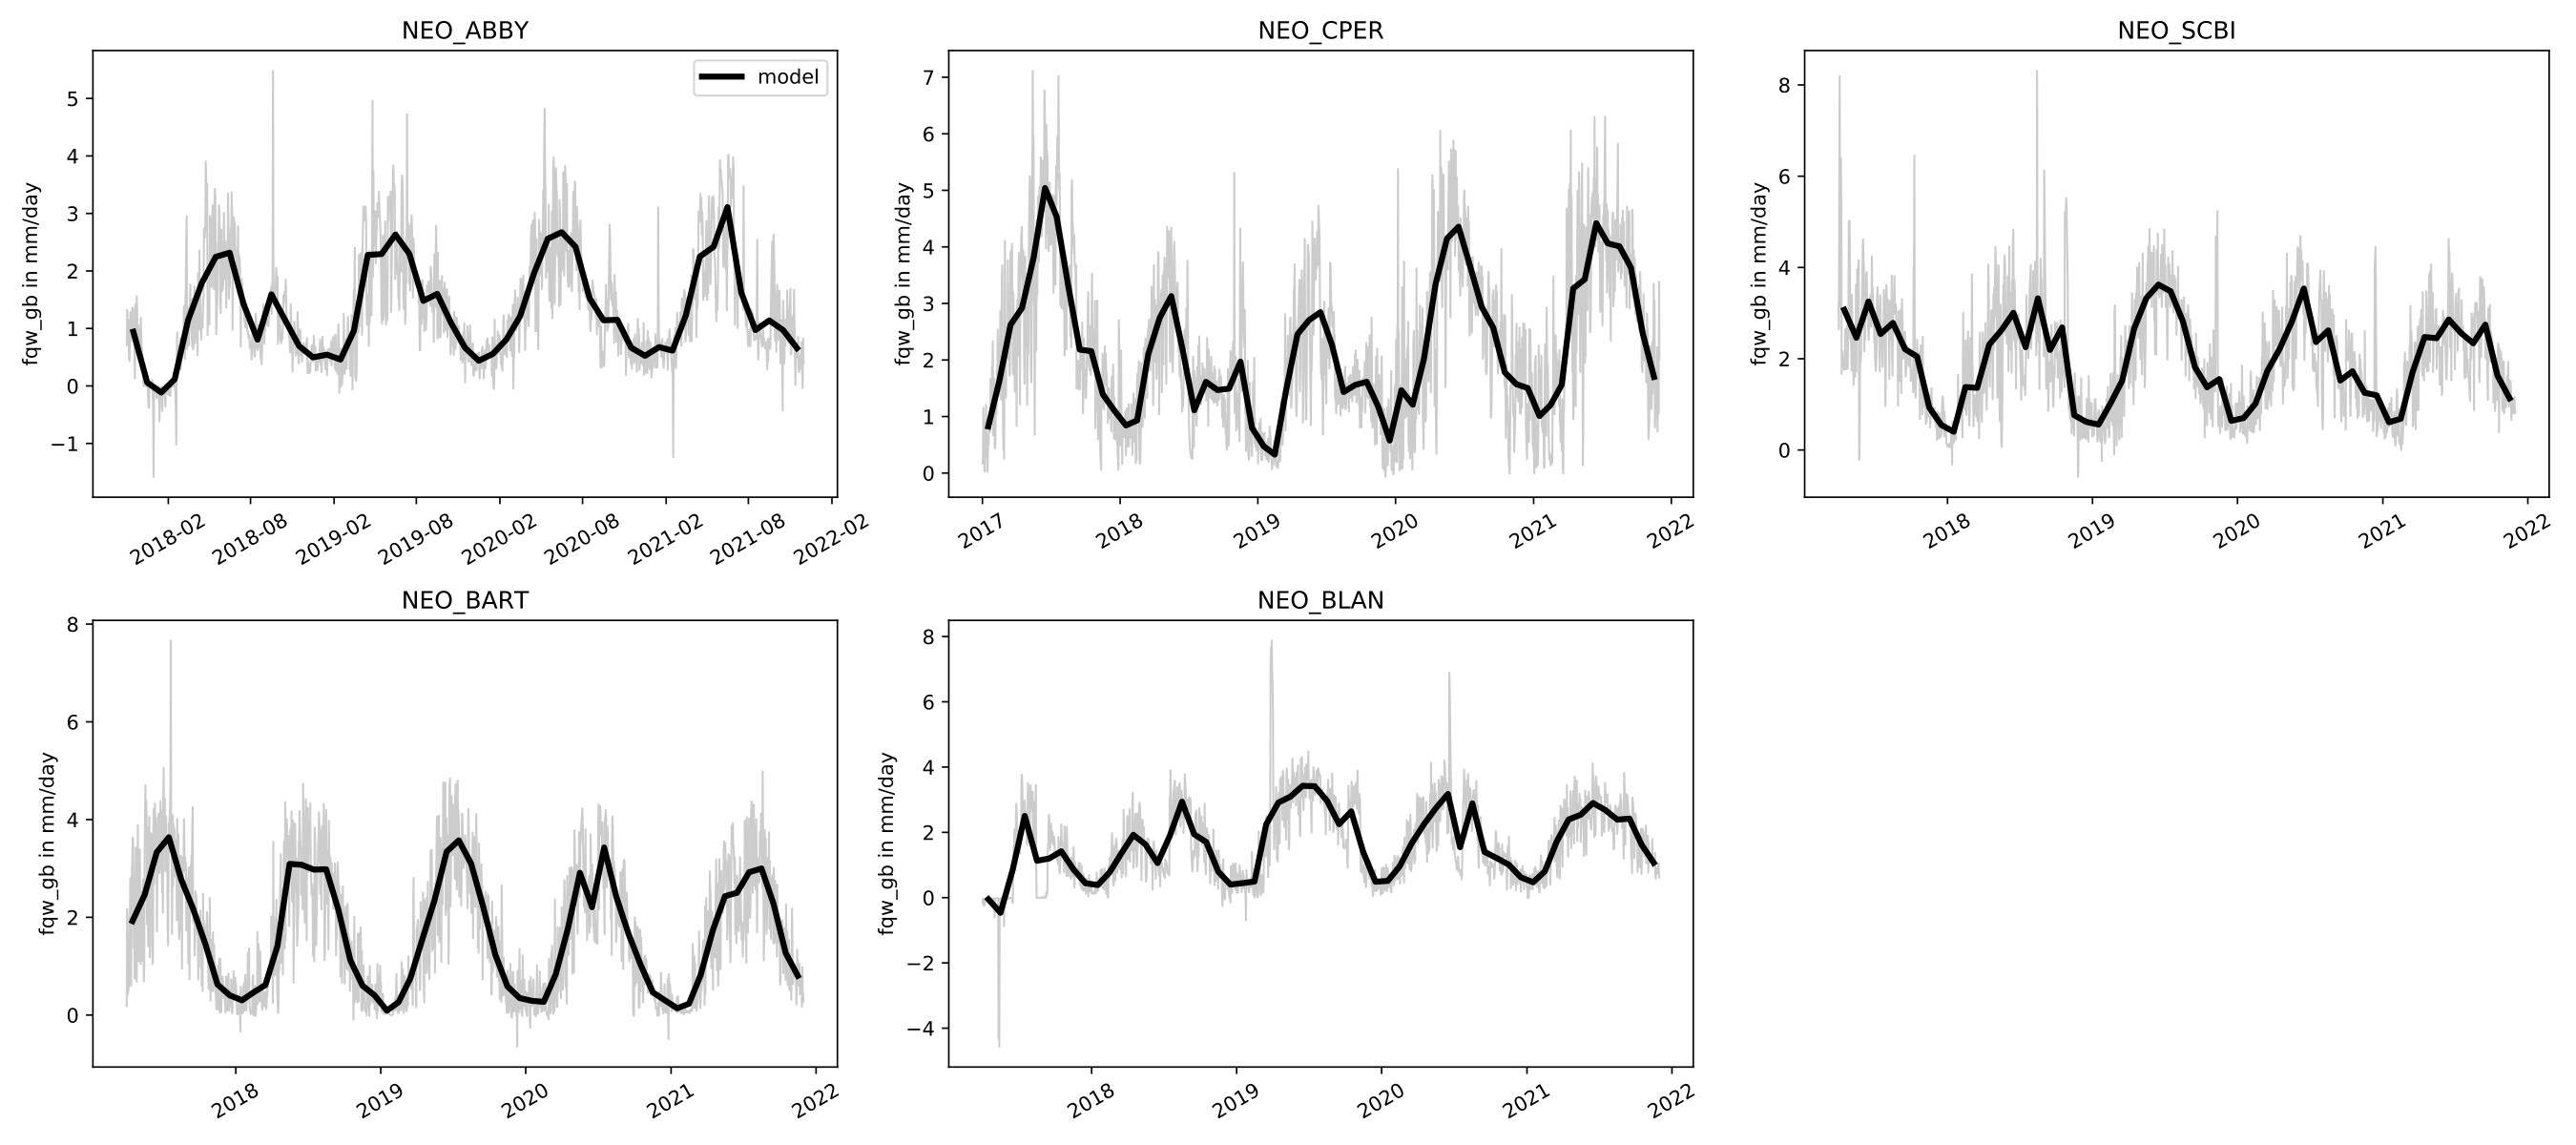
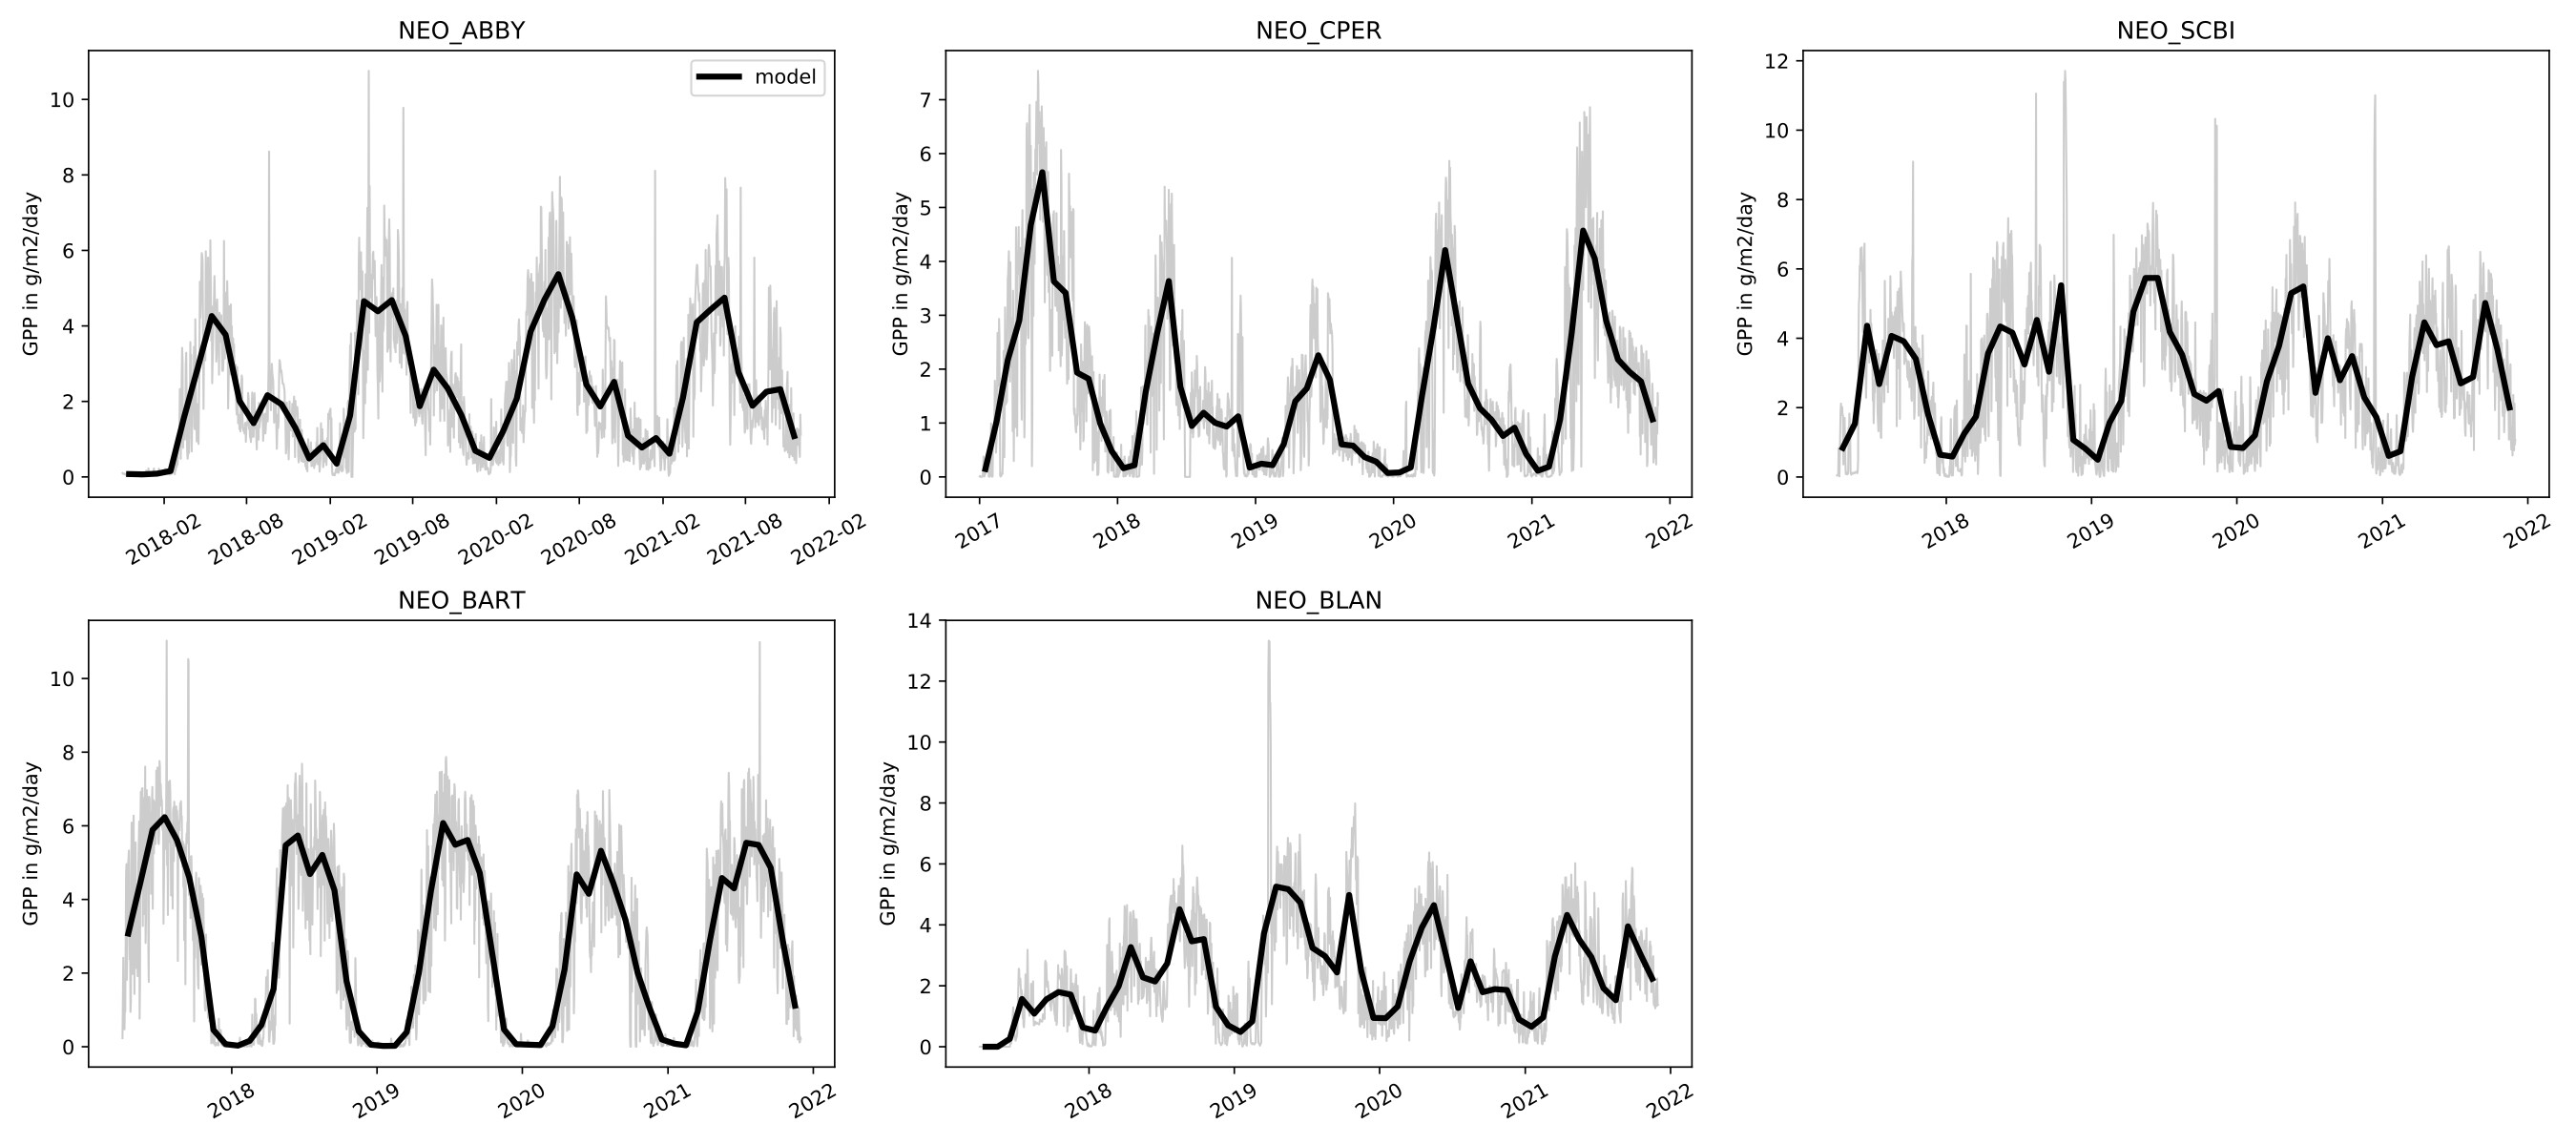
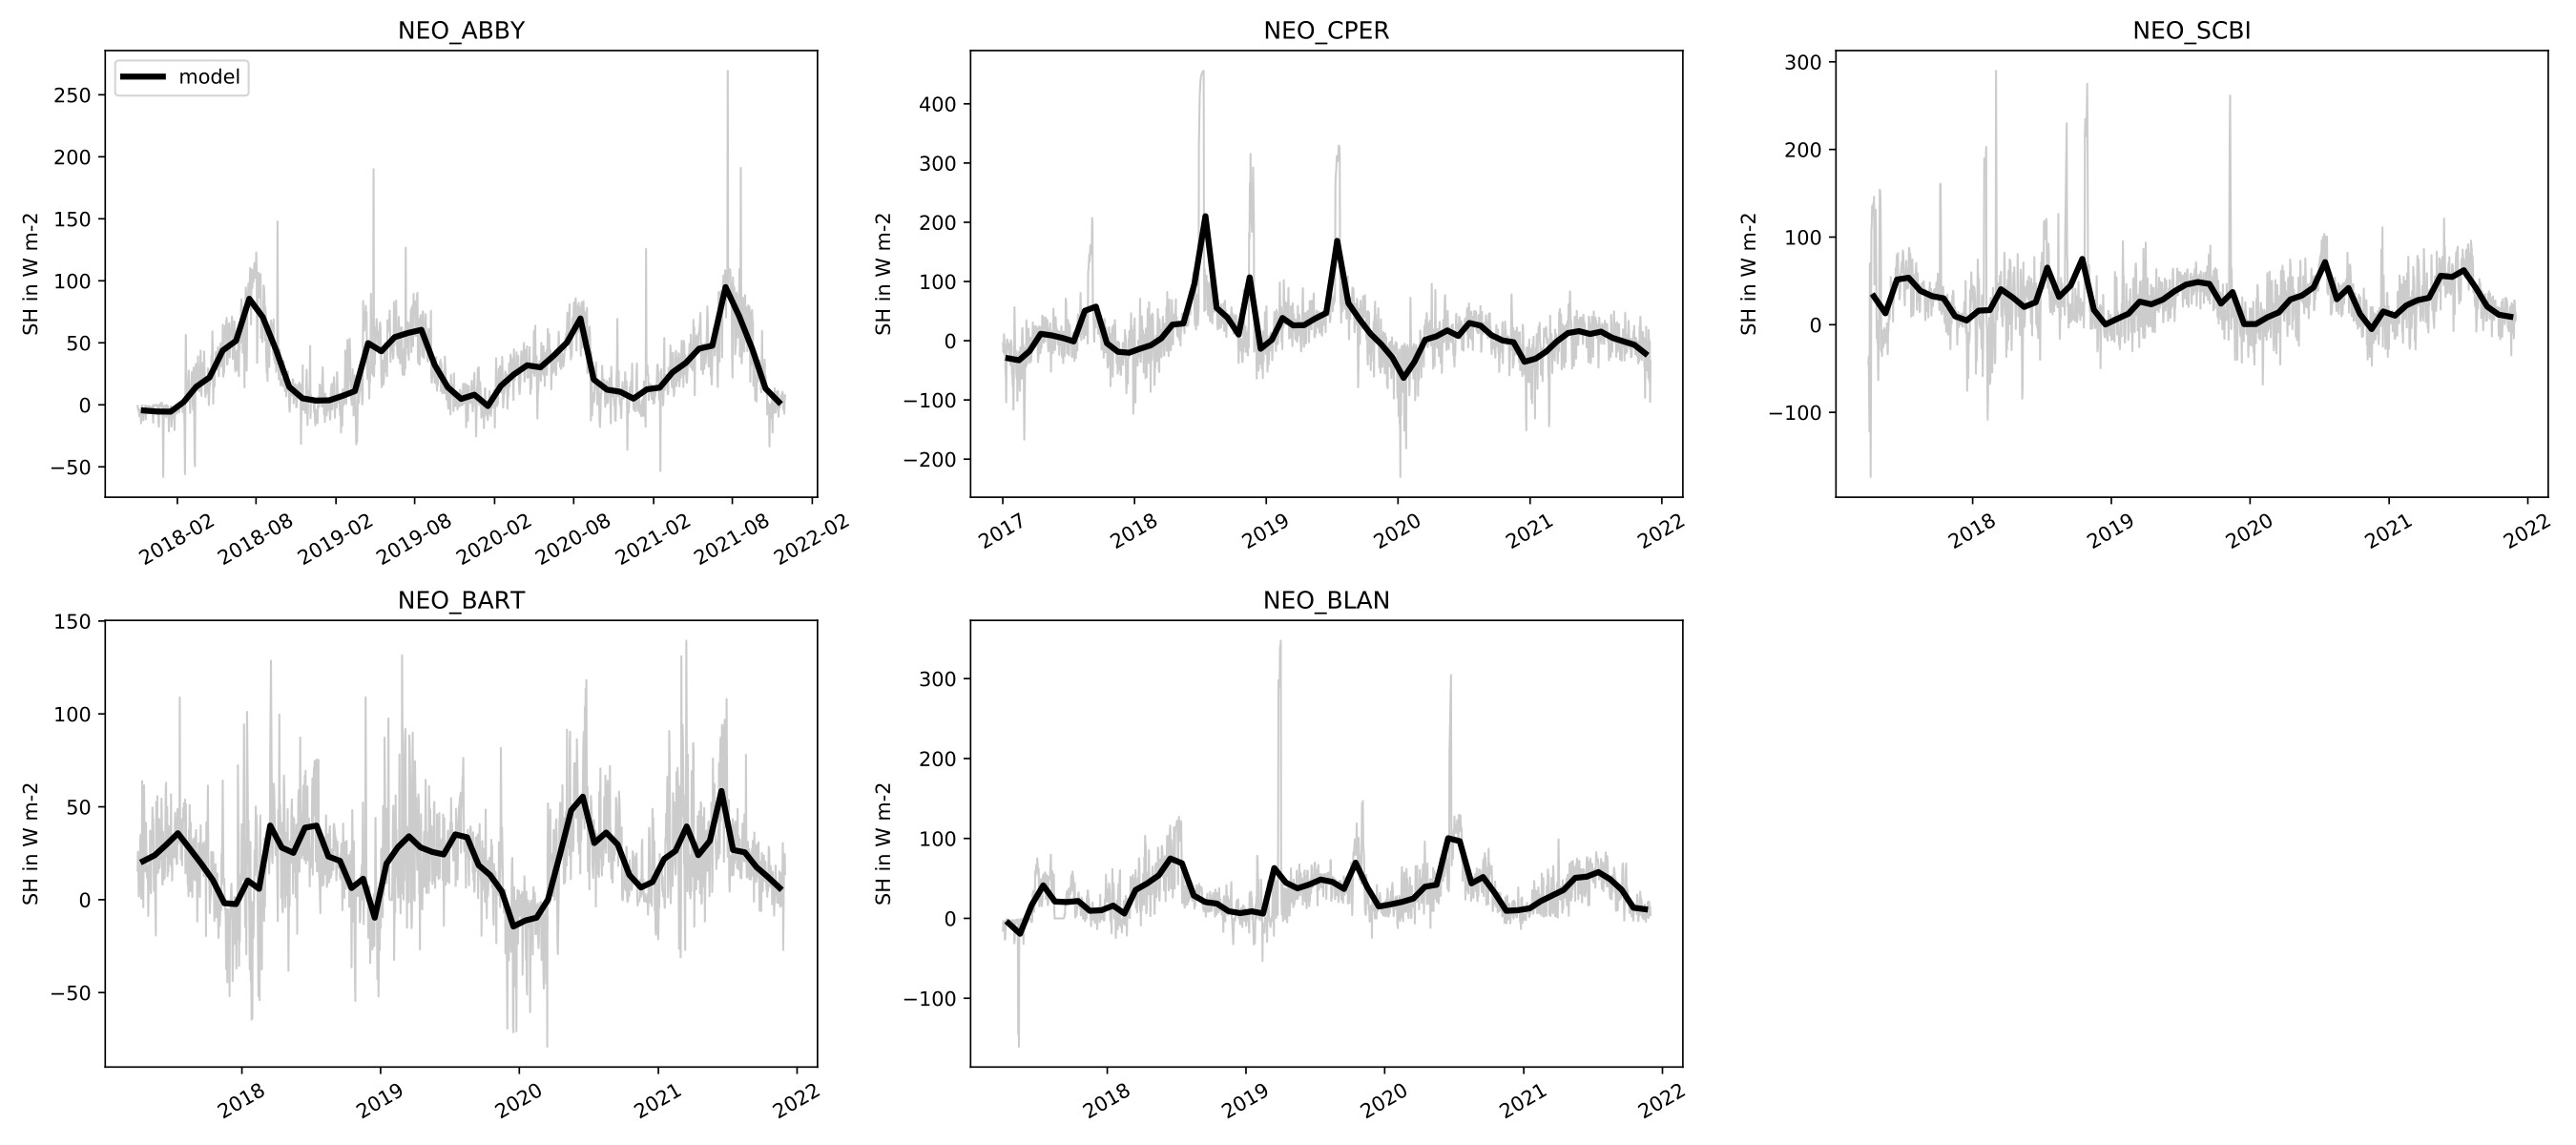
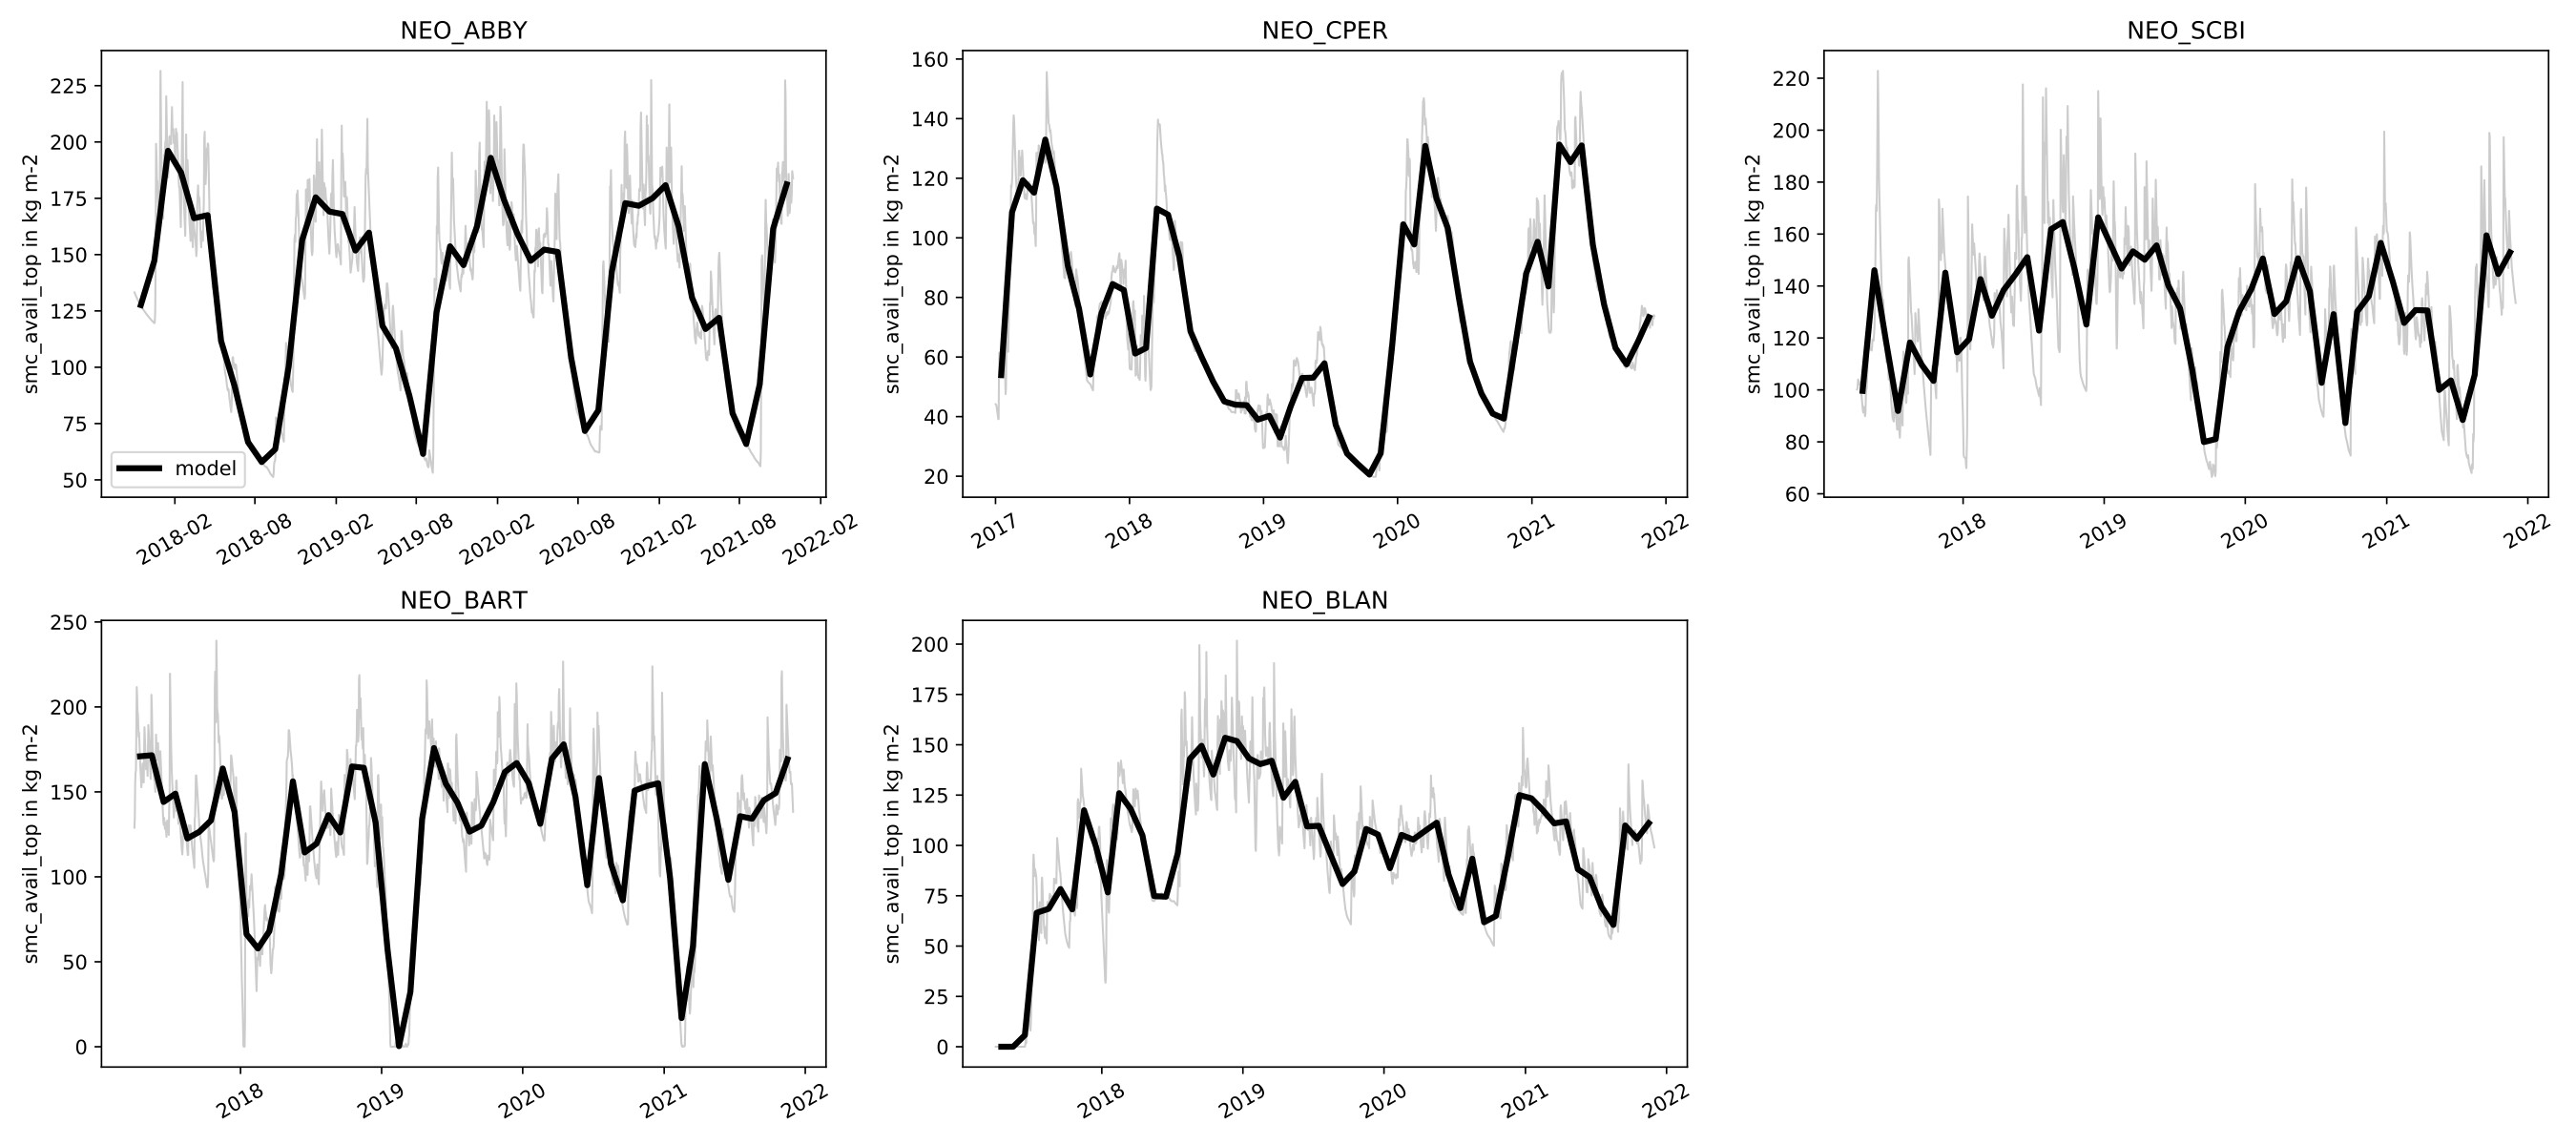
I am attaching the plots I made of the model output data for these 5 NEON sites with the u-al752 suite. These plots do not have the observed NEON data overlain. I will try to work on overlaying the observed NEON data next. This will be a fair amount of work to do. The thick black lines in the plots are the monthly average of the model, whereas the thin gray lines are the daily average of the model. The sites “ABBY” and “BLAN” possibly have some spinup problems or something, since their initial values in the main run are rather low or flatline for some of the output variables.
(See below for the plots, inline. There might be an option to zoom in from 75% to 100% for the plots, or you can download them. )
I failed to run the suite on a 6th site (“BARR”, in Alaska), since there were at least a couple of missing data files for primary or secondary precipitation, and my preprocessing code can’t handle that yet. It shouldn’t be hard to fix.
I am doing very-simple forward-fill gap-filling for the data at the moment, and this deals properly (without crashing) with all the other gaps in data that I have encountered so far. Of course, this very-simple gap-filling technique can be replaced with a more-sophisticated technique sometime in the future.
Patrick
et_stom_gb (Gridbox transpiration)
fqw_gb (Gridbox moisture flux from surface)
GPP
Latent Heat Flux
fsmc_gb (Gridbox soil moisture availability factor (beta))
Sensible Heat Flux
smc_avail_top (Gridbox available moisture in surface layer of depth of 1 meter)
Tristan has suggested that getting all 30-40 of the sites in suite is of higher priority than getting the observational energy/carbon fluxes in the suite. So I will switch to doing that.
Patrick
I suggest you add the observed fluxes for the sites you have already have first. Then turn attention to the core terrestrial sites, of which there are around 20, starting with the forest sites which is a subset of that (maybe 10-15, not sure).
Thanks,
Tristan.
Thanks Tristan:
I am working on downloading the data for 4 NEON terrestrial-core forest sites now. Guanica, Harvard, Talledega, and Wind River. After the data is downloaded, I will work on adding those 4 sites to the u-al752 JULES FLUXNET suite.
Can you apply at the JASMIN Accounts Portal for access to the landsurf_rdg group workspace?
I am doing the work on this GWS, and the code and NEON data are available at:
/gws/nopw/j04/landsurf_rdg/pmcguire/TristanQ
Patrick
OK - done. Although note that I am unlikely to use the suite personally. This is primarily for Natalie.
Thanks for doing that, Tristan!
Patrick
Hi Tristan:
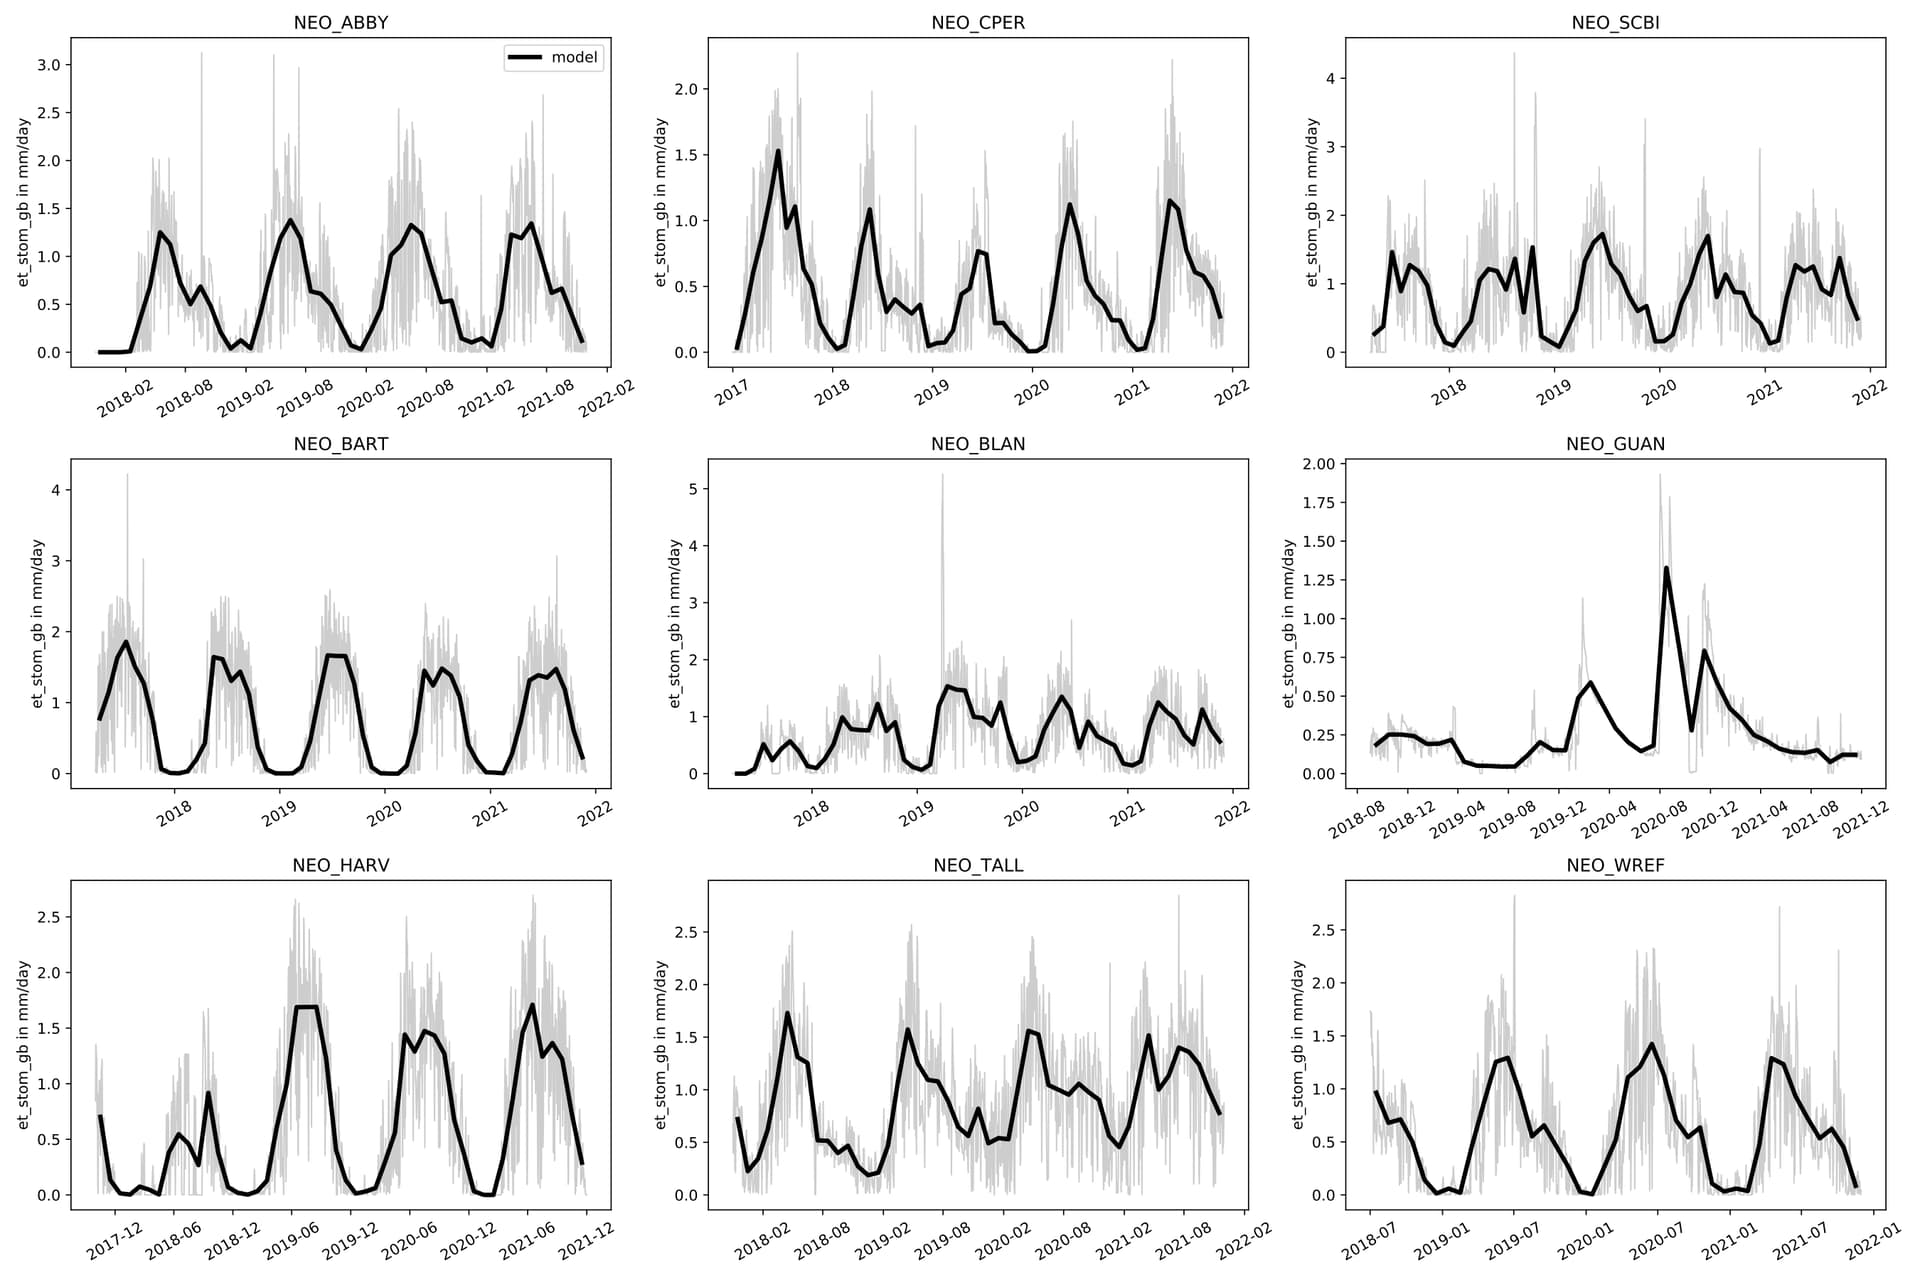
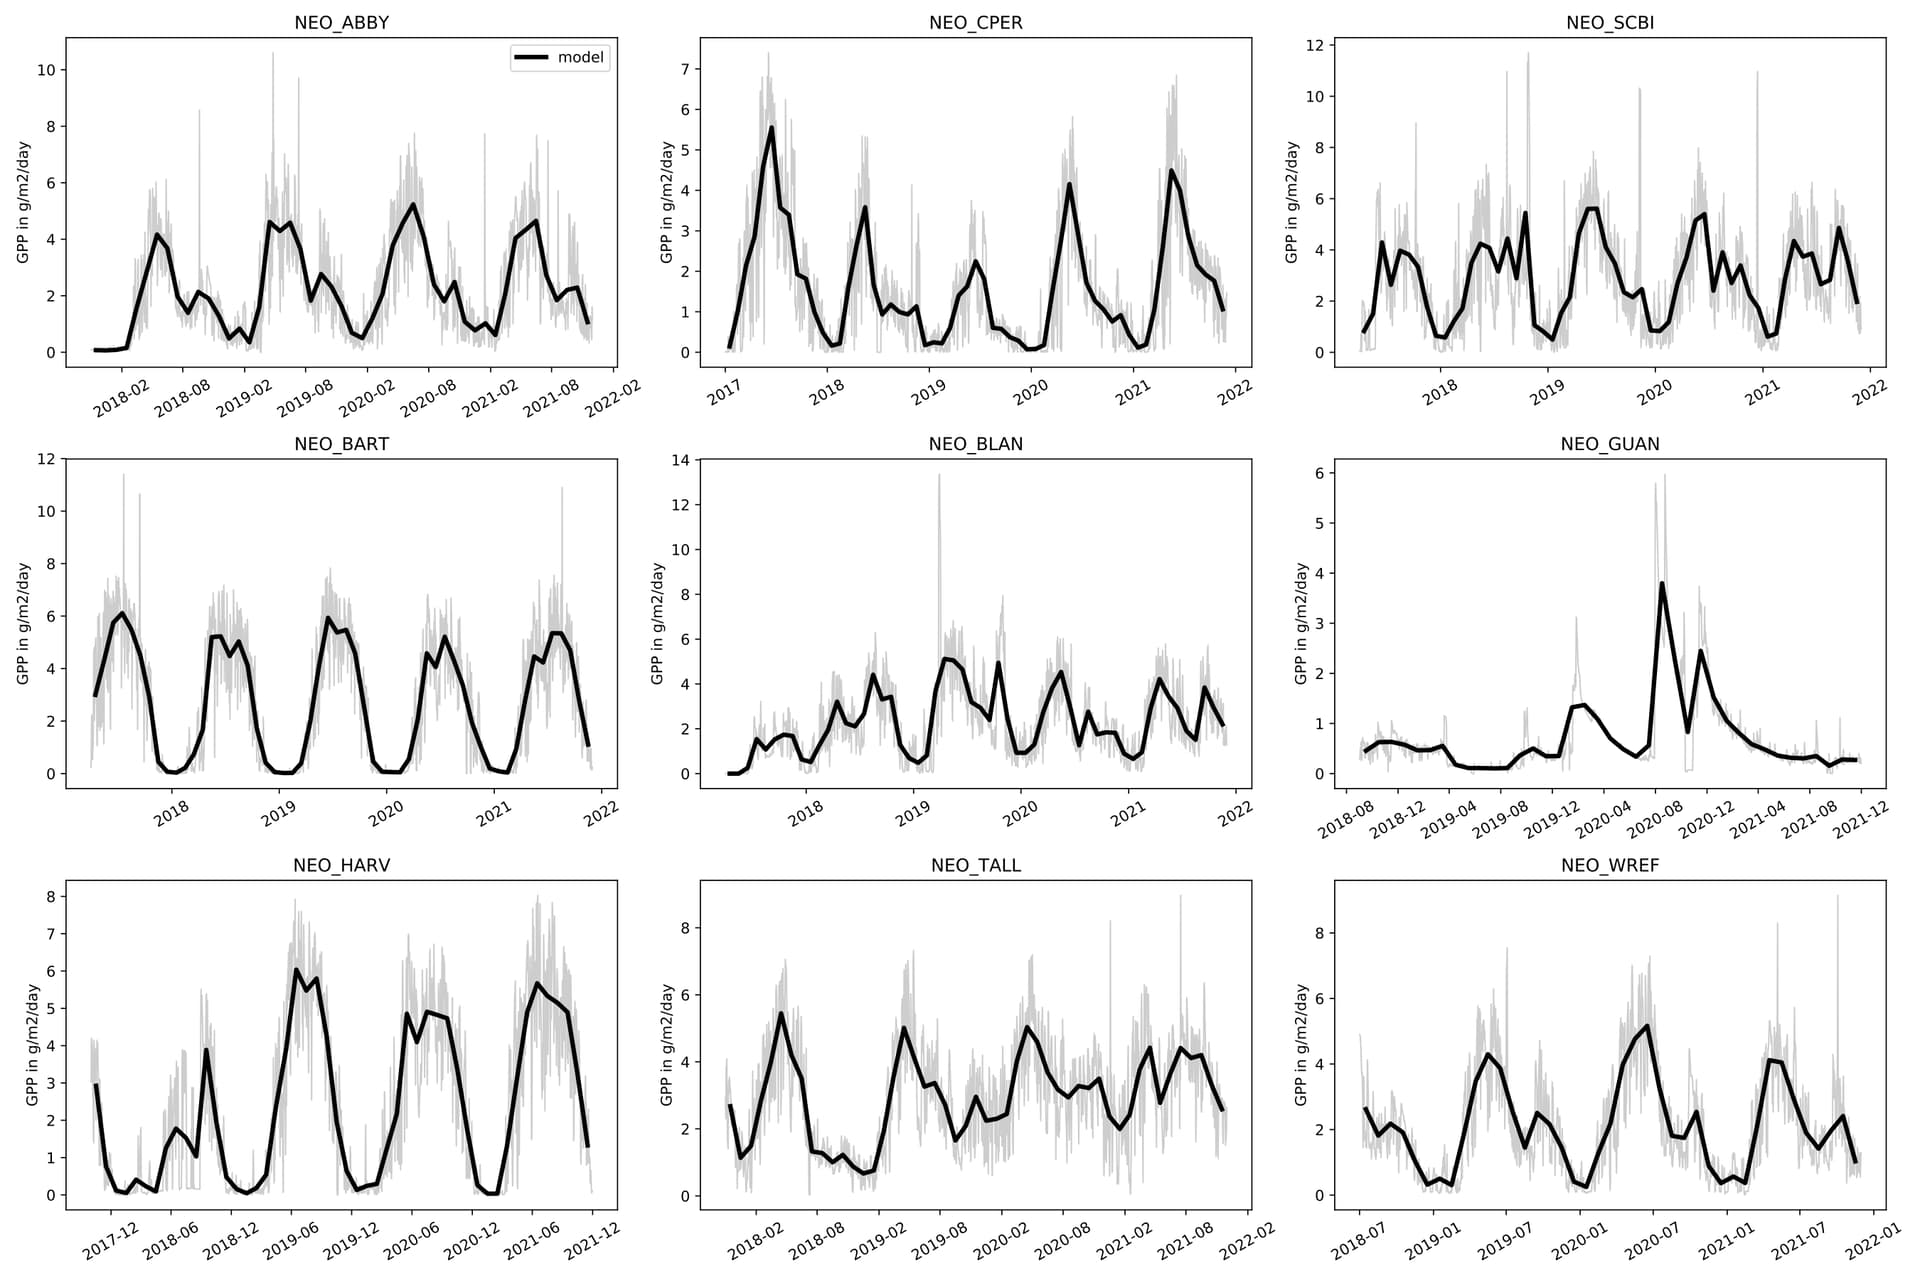
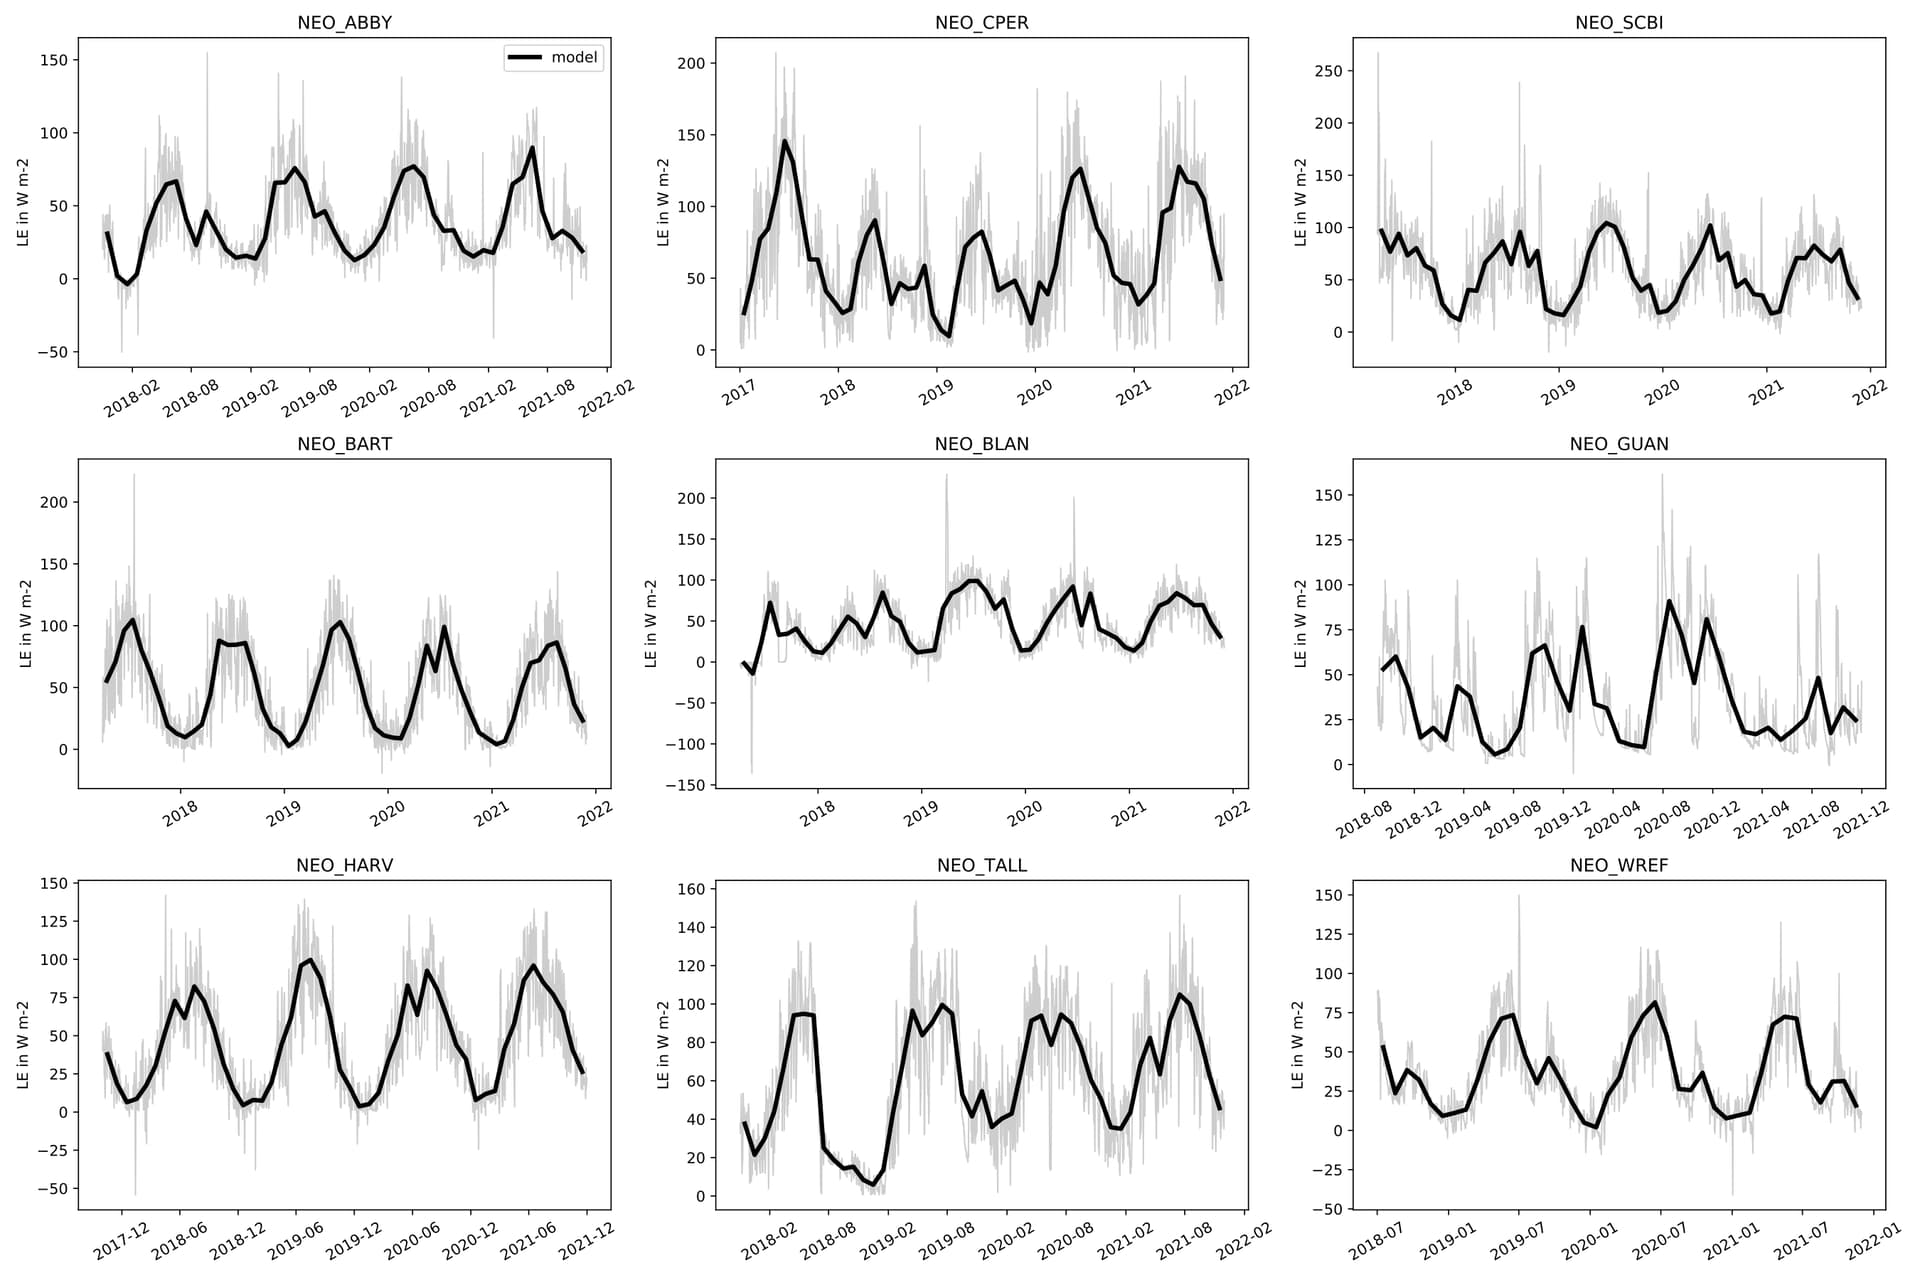
I have been able to use the new trunk version of the JULES FLUXNET/NEON suite u-al752 in order to run JULES for 8 spinup cycles and the main run for 4 NEON terrestrial-core forest sites: Guanica, Harvard, Talledega, and Wind River (“GUAN”,“HARV”,“TALL”, and “WREF”). The driving-data time range for these 4 NEON sites covered practically the whole range of data available for each site starting usually in 2017 or 2018. I ran until the end of 2021, which is the end of the global prescribed CO2 data that I amended.
I am attaching the plots I made of the model output data for all 9 of the NEON sites with the u-al752 suite, including for these 4 NEON terrestrial-core forest sites. These plots do not have the observed NEON data overlain, as we discussed by email. I will try to work on overlaying the observed NEON data next. This will be a fair amount of work to do. I will try to get this done before the AGU. The thick black lines in the plots are the monthly average of the model, whereas the thin gray lines are the daily average of the model. The site “GUAN” site doesn’t seem to have an annual cycle – or the inter-annual variability overrides this annual cycle – or there is some mistake that I made. As discussed before, the sites “ABBY” and “BLAN” possibly have some spinup problems or something, since their initial values in the main run are rather low or flatline for some of the output variables.
(See below for the plots, inline. There might be an option to zoom in from 75% to 100% for the plots, or you can download them. )
Patrick
et_stom_gb (Gridbox transpiration)
fqw_gb (Gridbox moisture flux from surface)
GPP
Latent Heat Flux
fsmc_gb (Gridbox soil moisture availability factor (beta))
Sensible Heat Flux
smc_avail_top (Gridbox available moisture in surface layer of depth of 1 meter)
Thanks Patrick. This looks really good to me.